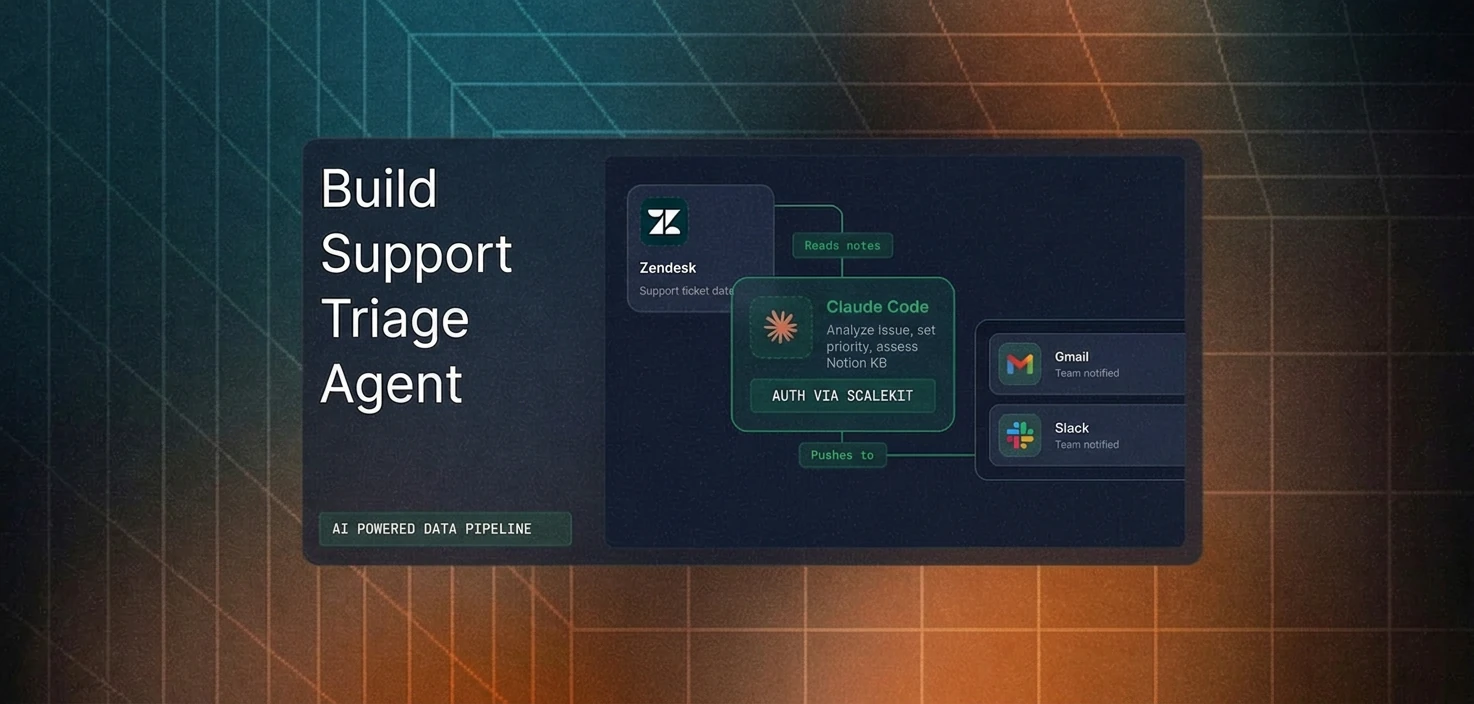
How to Build a Support Triage Agent with Zendesk, Slack, and Notion


TL;DR
- Every new Zendesk ticket sits unread until a human figures out what it is, who should own it, and whether the knowledge base (Notion KB) already has an answer. This agent fixes it: classify, search, route, and draft response for every ticket, automatically.
- Stack: Zendesk, Notion, Slack, OpenRouter, wired through Scalekit Agent Auth. One execute_tool() call per service. No OAuth plumbing. No token management.
- Clone the repo → Configure your agent connectors; run it. Hardly 20 minutes.
Why Triage Becomes the Hidden Bottleneck in Support
When a new support ticket arrives, the work doesn't start with fixing the issue; it starts with figuring out what the issue actually is. Someone has to read the ticket, understand the context, determine its urgency, check whether there's already a knowledge base article for it, and then route it to the right team. This process, known as triage, happens for every single ticket.
The problem is that none of this work directly resolves the issue, yet every ticket depends on it before anything meaningful can begin. For teams handling dozens of tickets a day, even a few minutes spent on triage per ticket quickly adds up to hours of repetitive effort.
Over time, this leads to predictable problems: tickets get misclassified, routing mistakes introduce delays, and consistency drops as workload increases. The result is not just slower response times, but a system that becomes harder to rely on as scale grows. This is the bottleneck we are solving, and most teams underestimate it.
How This Triage System Works: A Deterministic Pipeline
This agent isn't an autonomous system that continuously reasons or iterates over decisions. Instead, it follows a deterministic pipeline, triggered by polling or a webhook, and sequentially processes each ticket, then exits. There is no persistent memory. That's a deliberate design choice.
Every execution follows the same structure: classification, knowledge retrieval, routing, and ticket update. This makes the system predictable, testable, and easier to operate in production environments.
How Every Ticket Gets Processed
Once a ticket enters the system, it moves through a structured sequence of steps that mirrors how a human agent would perform triage, but in a consistent and automated manner.
- Classify: LLM reads subject + description, returns category (billing, bug, feature request, how-to, account issue) and severity (P0–P3).
- Search KB: For bugs, how-tos, and account issues, the agent queries Notion. Billing and feature requests skip this step.
- Route: Posts a structured alert to the right Slack channel with category, severity, KB links, and a draft response.
- Update: Writes tags, priority, and a private internal note back to Zendesk.
By the time the support team opens the ticket, triage is done. Agents start from context, resulting in operational benefits:
- Immediate context instead of raw tickets
- Consistent information across tools
- Faster response times
- Accurate routing with fewer handoffs
- Consistency at scale
How the Triage Flow Works?
So far, we have looked at the problem, the system design, and the high-level process for each ticket. To make this more concrete, let's break down how decisions are made and how different services interact during execution.
Decision Flow: How Each Ticket Is Routed
The diagram below shows how a ticket moves through classification, knowledge base (KB) lookup, and routing before being written back to Zendesk.

To make the flow easier to follow, here is how each step in the diagram maps to the actual pipeline:
- Classify the ticket using the LLM: The system analyzes the ticket's subject and description to determine its category and severity.
- Decide whether a knowledge base search is needed: Tickets classified as bugs, how-to questions, or account issues trigger a Notion search, while billing and feature request tickets skip this step.
- Fetch relevant knowledge (if applicable): When required, the system retrieves matching articles from the Notion knowledge base.
- Route to the appropriate Slack channel: The ticket is sent to the correct team channel based on its category.
- Updated the Zendesk ticket: Tags, priority, and an internal note were added with the full triage context.
Note: In production, you have to handle logic for additional safeguards to be applied to handle failures, retries, and rate limits.
Execution Flow: How Services Interact During a Run
While the previous diagram focuses on decision-making, the next diagram shows how the system interacts with each service during execution.
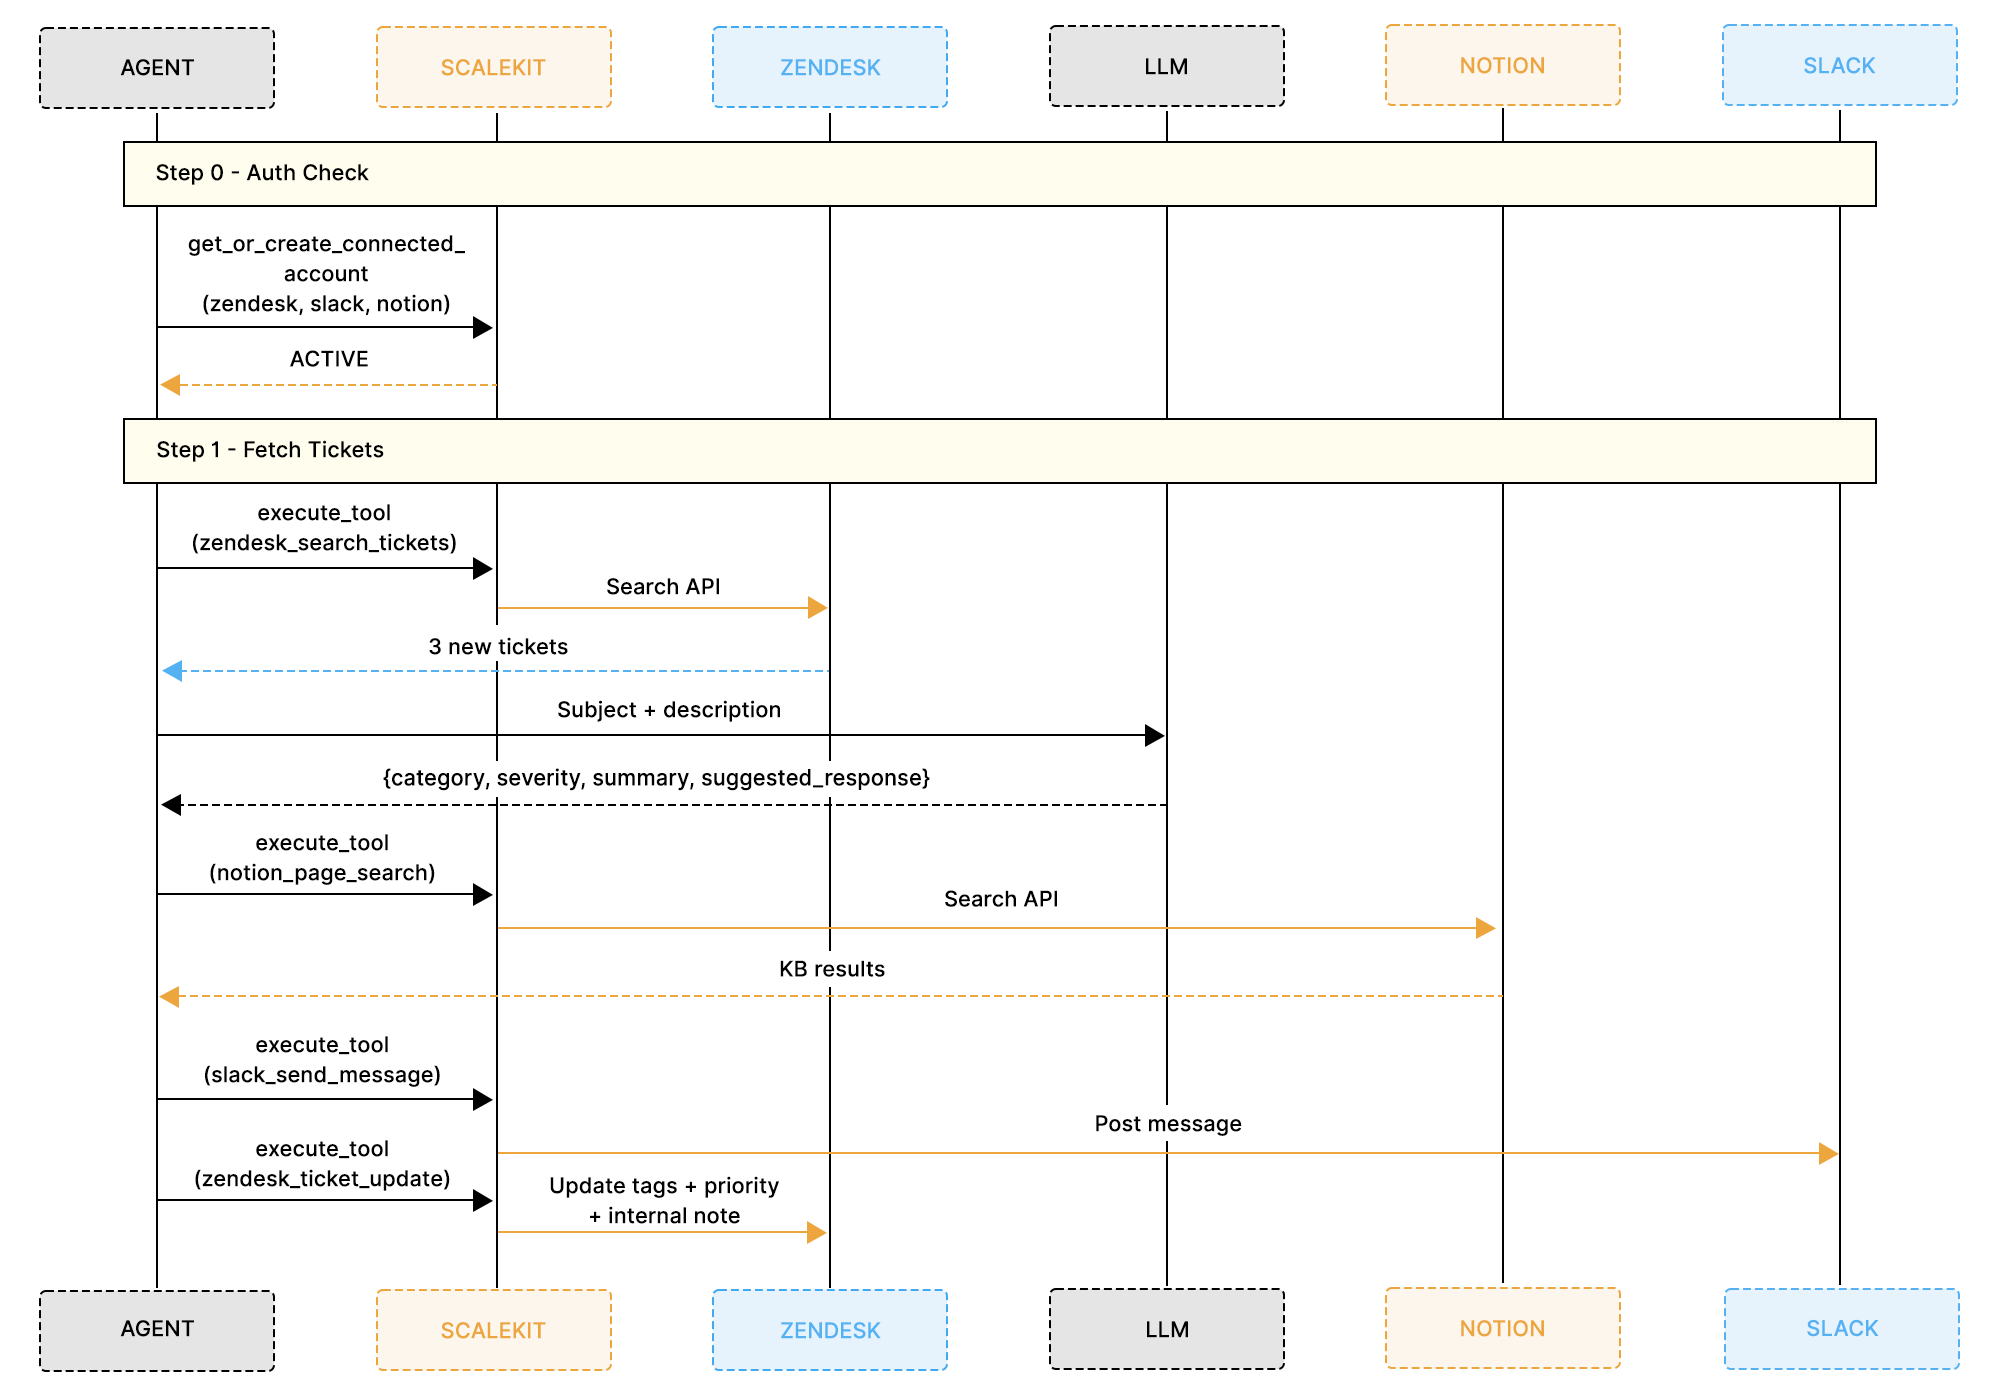
Each execution cycle follows a consistent sequence:
- Check connector authentication: The system verifies that Zendesk, Notion, and Slack are all active.
- Fetch new tickets from Zendesk: Tickets with status new or open are retrieved for processing.
- Send ticket data to the LLM: The model returns structured output, including category, severity, summary, and a suggested response.
- Query Notion (if required): Relevant knowledge base articles are retrieved based on the ticket content.
- Post a structured alert to Slack: A message is sent to the appropriate channel with all relevant context.
- Update Zendesk with triage results: The ticket is updated with tags, priority, and an internal note.
By routing all interactions through a single execute_tool() interface, the system coordinates multiple services in a unified workflow without requiring separate authentication logic.
What a Triage Output Looks Like in Practice
The output of each triage run is delivered as a structured Slack message in the appropriate team channel.

This message is designed so that a support agent can immediately understand the issue, access relevant context, and begin drafting a response without opening Zendesk.
Each part of the message is generated from real data within the pipeline:
- Category and severity are determined by the LLM based on the ticket content
- Knowledge base links are retrieved from Notion when relevant
- Suggested response is generated directly from the ticket description
At the same time, the same information is written back to Zendesk as a private internal note, along with updated tags and priority. This ensures that, whether a team member starts in Slack or directly in Zendesk, they have access to the same complete triage context.
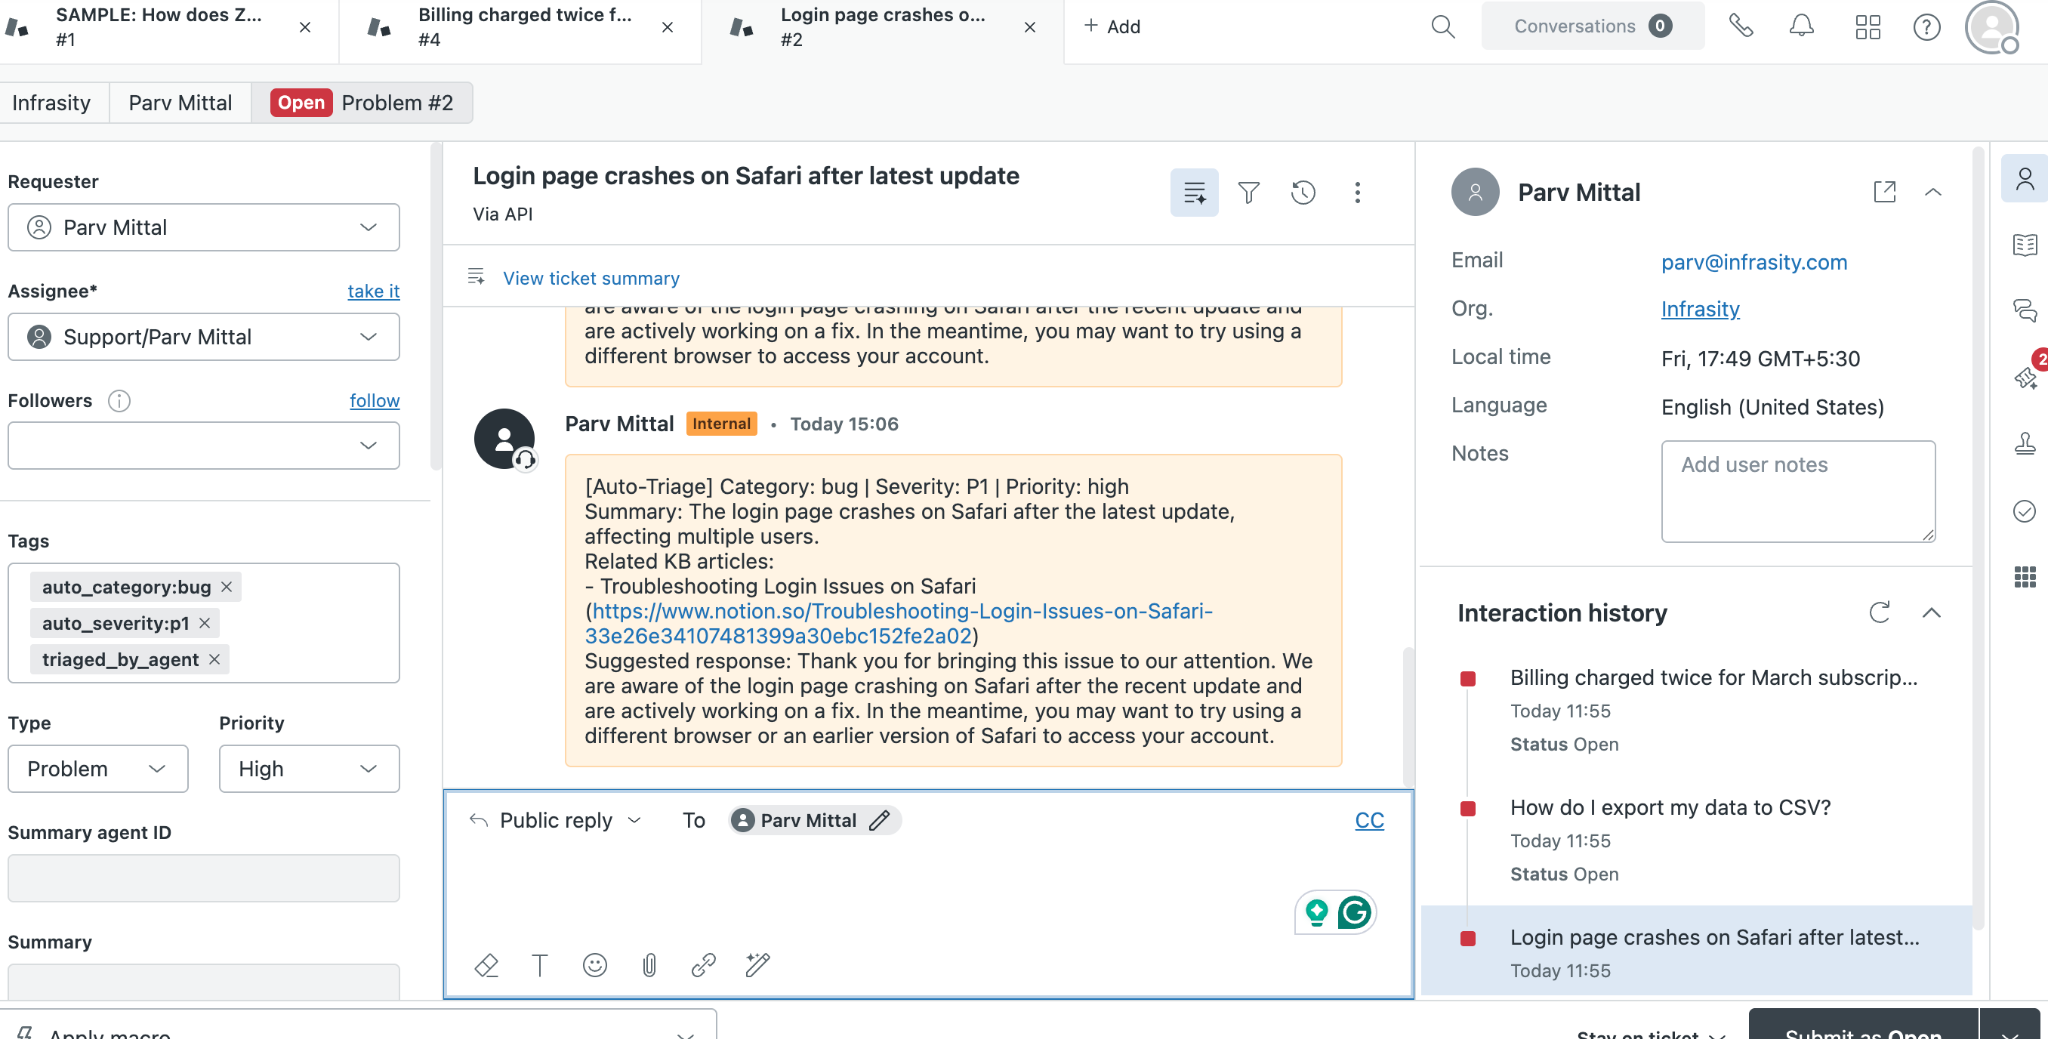
This output layer is what makes the system immediately useful in day-to-day workflows. It bridges automation with how support teams already operate.
Prerequisites
- A Scalekit account (free tier is sufficient) with a new workspace created for this project
- A Zendesk account with API access enabled and at least a few test tickets available
- A Notion workspace with a KB database containing articles your support team references
- A Slack workspace with routing channels already created: #engineering, #billing, #product-feedback, and #support-triage
- An OpenRouter API key with access to openai/gpt-4o-mini or a similar paid model
- Python 3.11 or newer is installed locally
Project Setup
The entire agent lives in a single file called run_flow.py. Clone the repo and install the three dependencies it needs:
Create a .env file in the project directory with credentials for every service the agent connects to:
One important detail on SLACK_CONNECTOR: this value must match the connector name in your Scalekit dashboard exactly, including capitalization. The connector name becomes the prefix for all tool names, so a connector named slack exposes tools named slack_send_message and slack_list_channels. A mismatch here causes execute_tool() calls to fail silently.
Why Authentication Is the Hardest Part of Multi-Tool Automation
Before writing any triage logic, you need all three services authenticated and ready. In a typical setup, that means three separate auth implementations, each with its own quirks.
- Zendesk uses Basic auth tied to a specific subdomain. Your API base URL is not api.zendesk.com, but yourcompany.zendesk.com, and a subdomain mismatch causes every call to fail with a 401.
- Notion requires you to register a public integration in the Notion Developer Hub – with a redirect URI, client ID, and secret – before any OAuth flow will run. After OAuth completes, access is limited to pages the user explicitly selected in Notion's page picker. If your KB database wasn't in that selection, notion_page_search returns empty results. No error. Just empty. If you haven't seen this before, you'll spend an hour convinced your search logic is broken.
- Slack requires specific bot token scopes set in your app dashboard before OAuth. channels:history reads public channel messages. groups:history is a separate scope for private channels. Ask for the wrong one and you get a missing_scope error at runtime, not an auth error, which looks identical to a data access problem during debugging. And if chat:write is missing, posting to a channel returns not_in_channel even when the bot is in the channel.
That's three connectors, three separate OAuth implementations, three different token formats, and three failure modes you'll hit before writing the first line of triage logic. Most multi-service agent projects stall here.
Managing all three independently means building token storage, refresh logic, and error handling for each one before writing a single line of triage logic. This is where most multi-service agent projects stall.
How Scalekit Handles Auth Across All Three Connectors
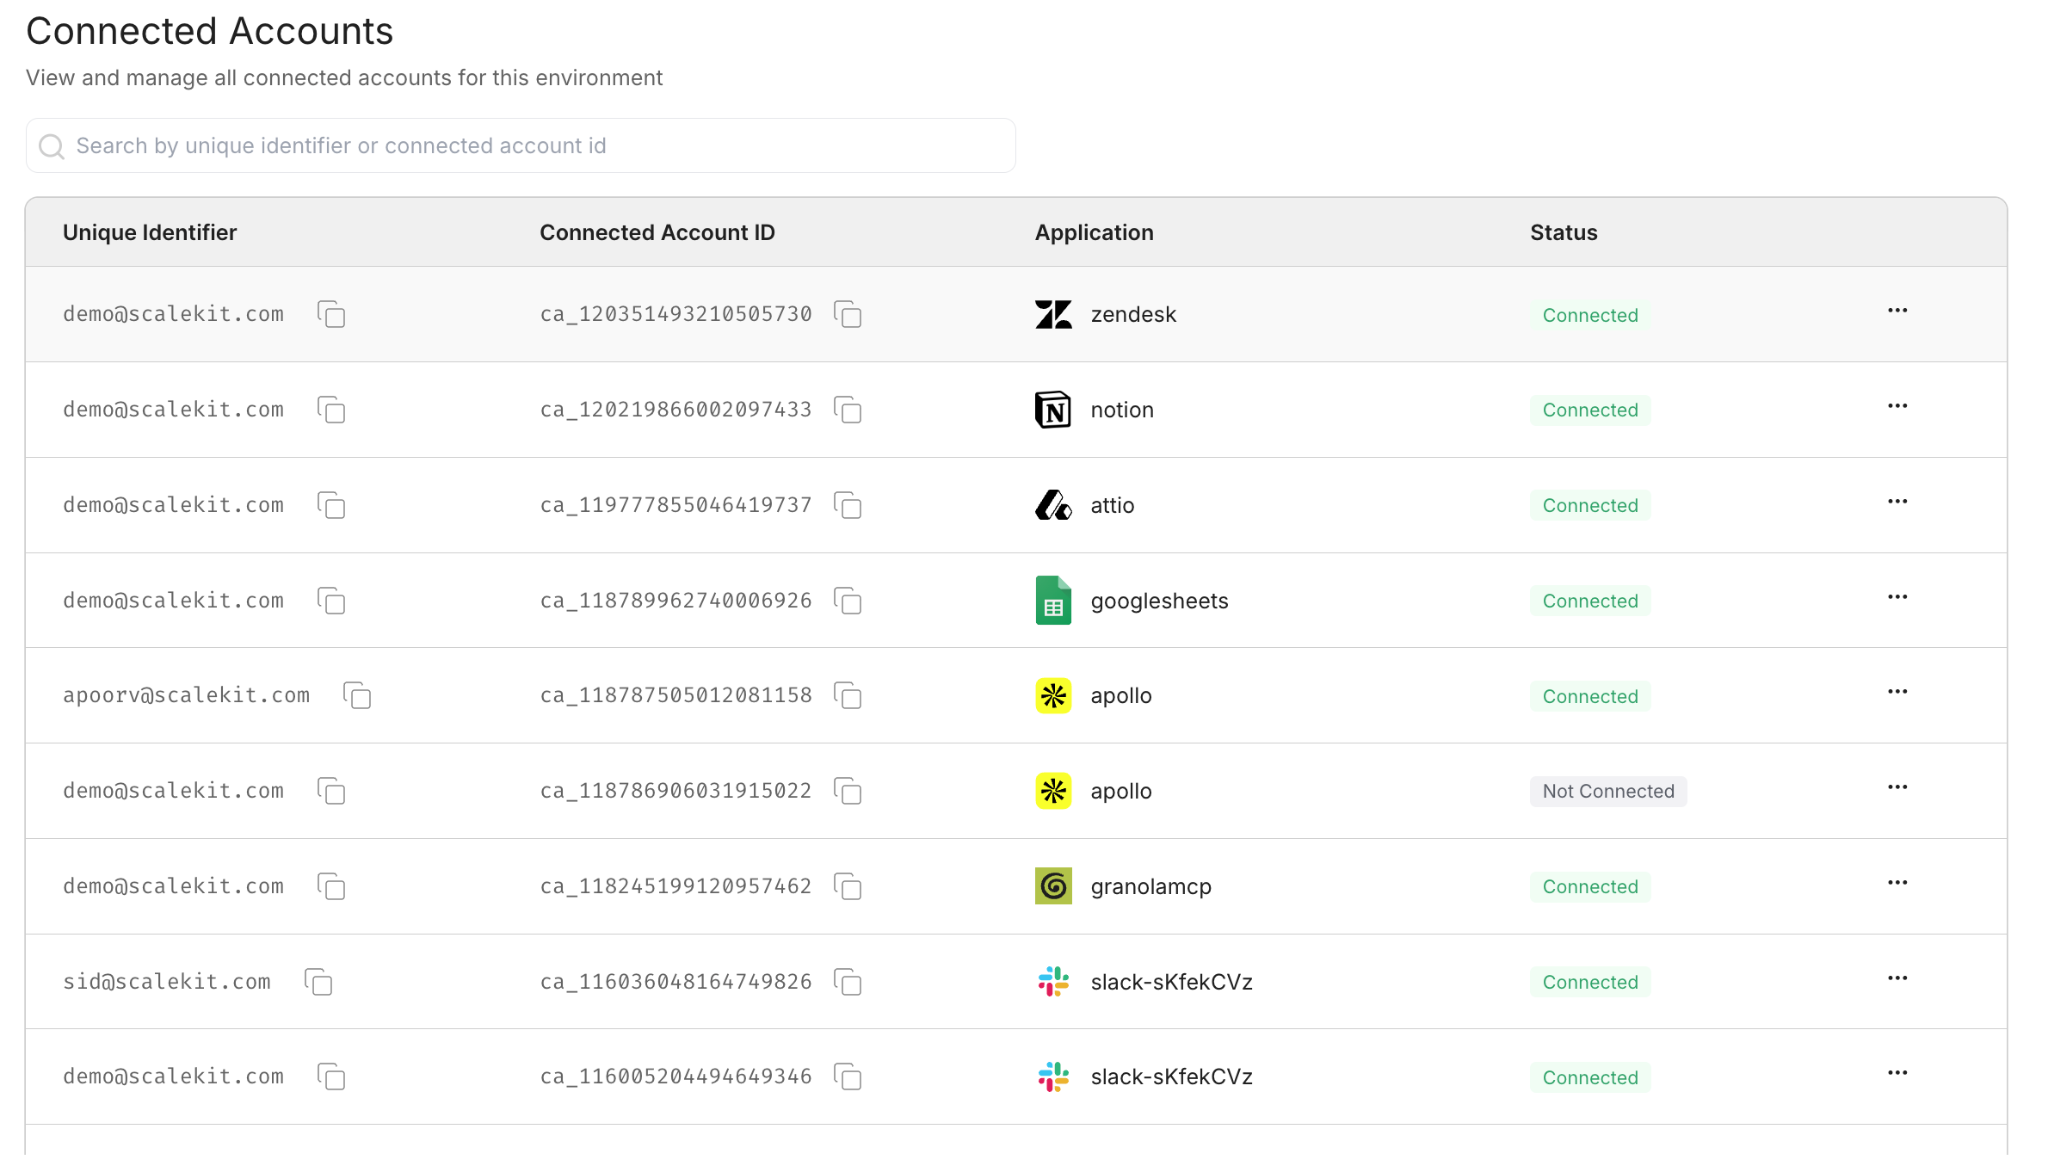
Scalekit is the auth layer between your agent and every service it calls. Configure each connector once in the dashboard. After that, every API call, be it to Zendesk, Notion, or Slack – it goes through the same execute_tool() interface. Token expiry, refresh cycles, and reconnection are handled server-side. There is no token in your code.
- Configure once, run forever. Each connector goes through its auth flow exactly once. On the first run, Scalekit generates a magic link for any connector not yet authorized. Every subsequent run picks up from ACTIVE without prompting again.
- One call pattern for everything. Every API call to every service goes through the same execute_tool() method. There is no Zendesk SDK to import, no Notion client to initialize, no Slack WebClient to configure.
- Zero token management. Token expiry, refresh cycles, and connection state are all handled by Scalekit. The agent never stores a token or hits a mid-run failure because a credential silently expired.
How to Set Up Your Connectors in Scalekit
Set up all three connectors before writing any code. The first run of the agent checks the connector status immediately, and having all three active means you can test the full pipeline from the very first execution.
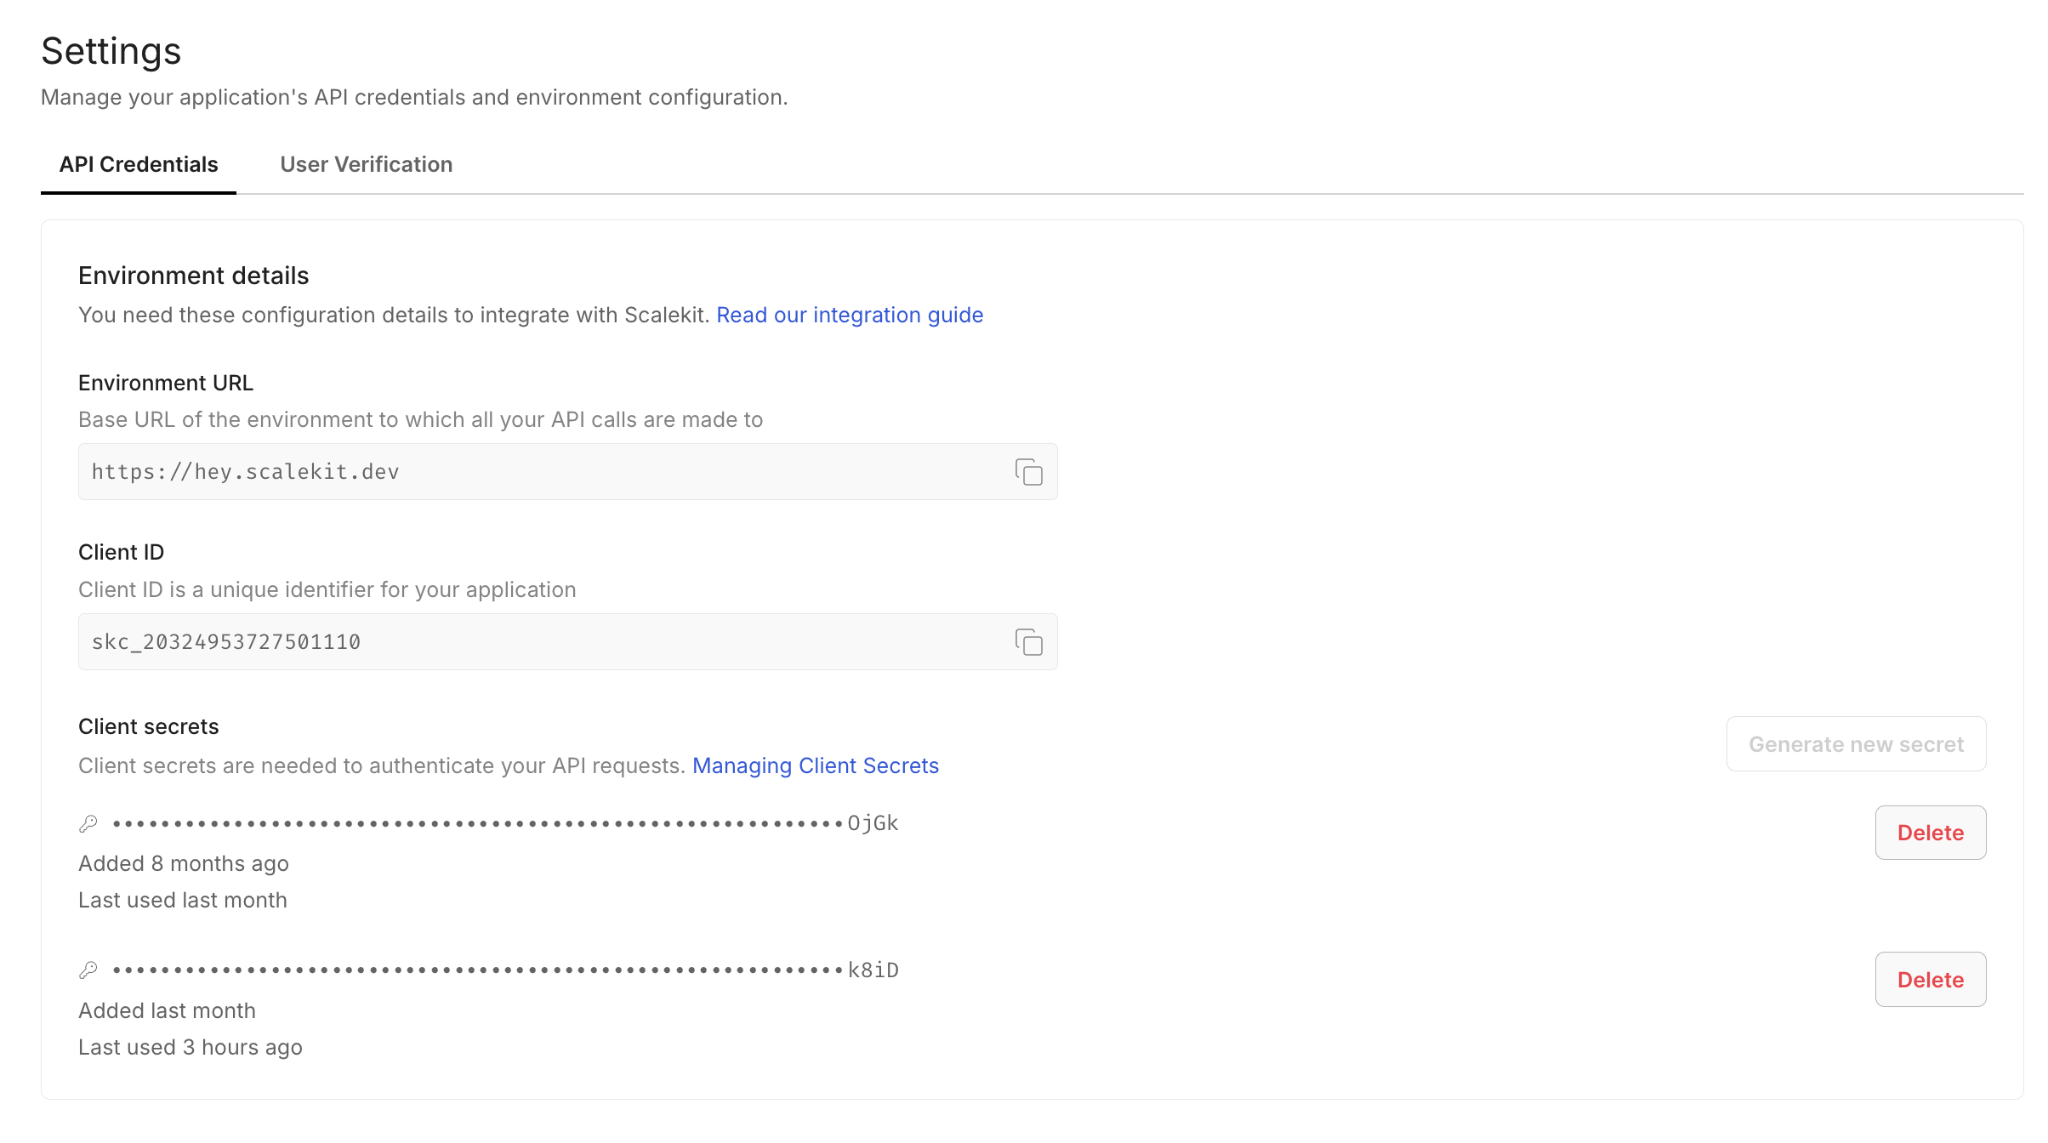
Step 1: Create Your Scalekit Account
Go to scalekit.com, create a free account, and create a new workspace for this project. Copy the SCALEKIT_ENV_URL, SCALEKIT_CLIENT_ID, and SCALEKIT_CLIENT_SECRET from the workspace dashboard into your .env file.
Step 2: Add the Zendesk Connector
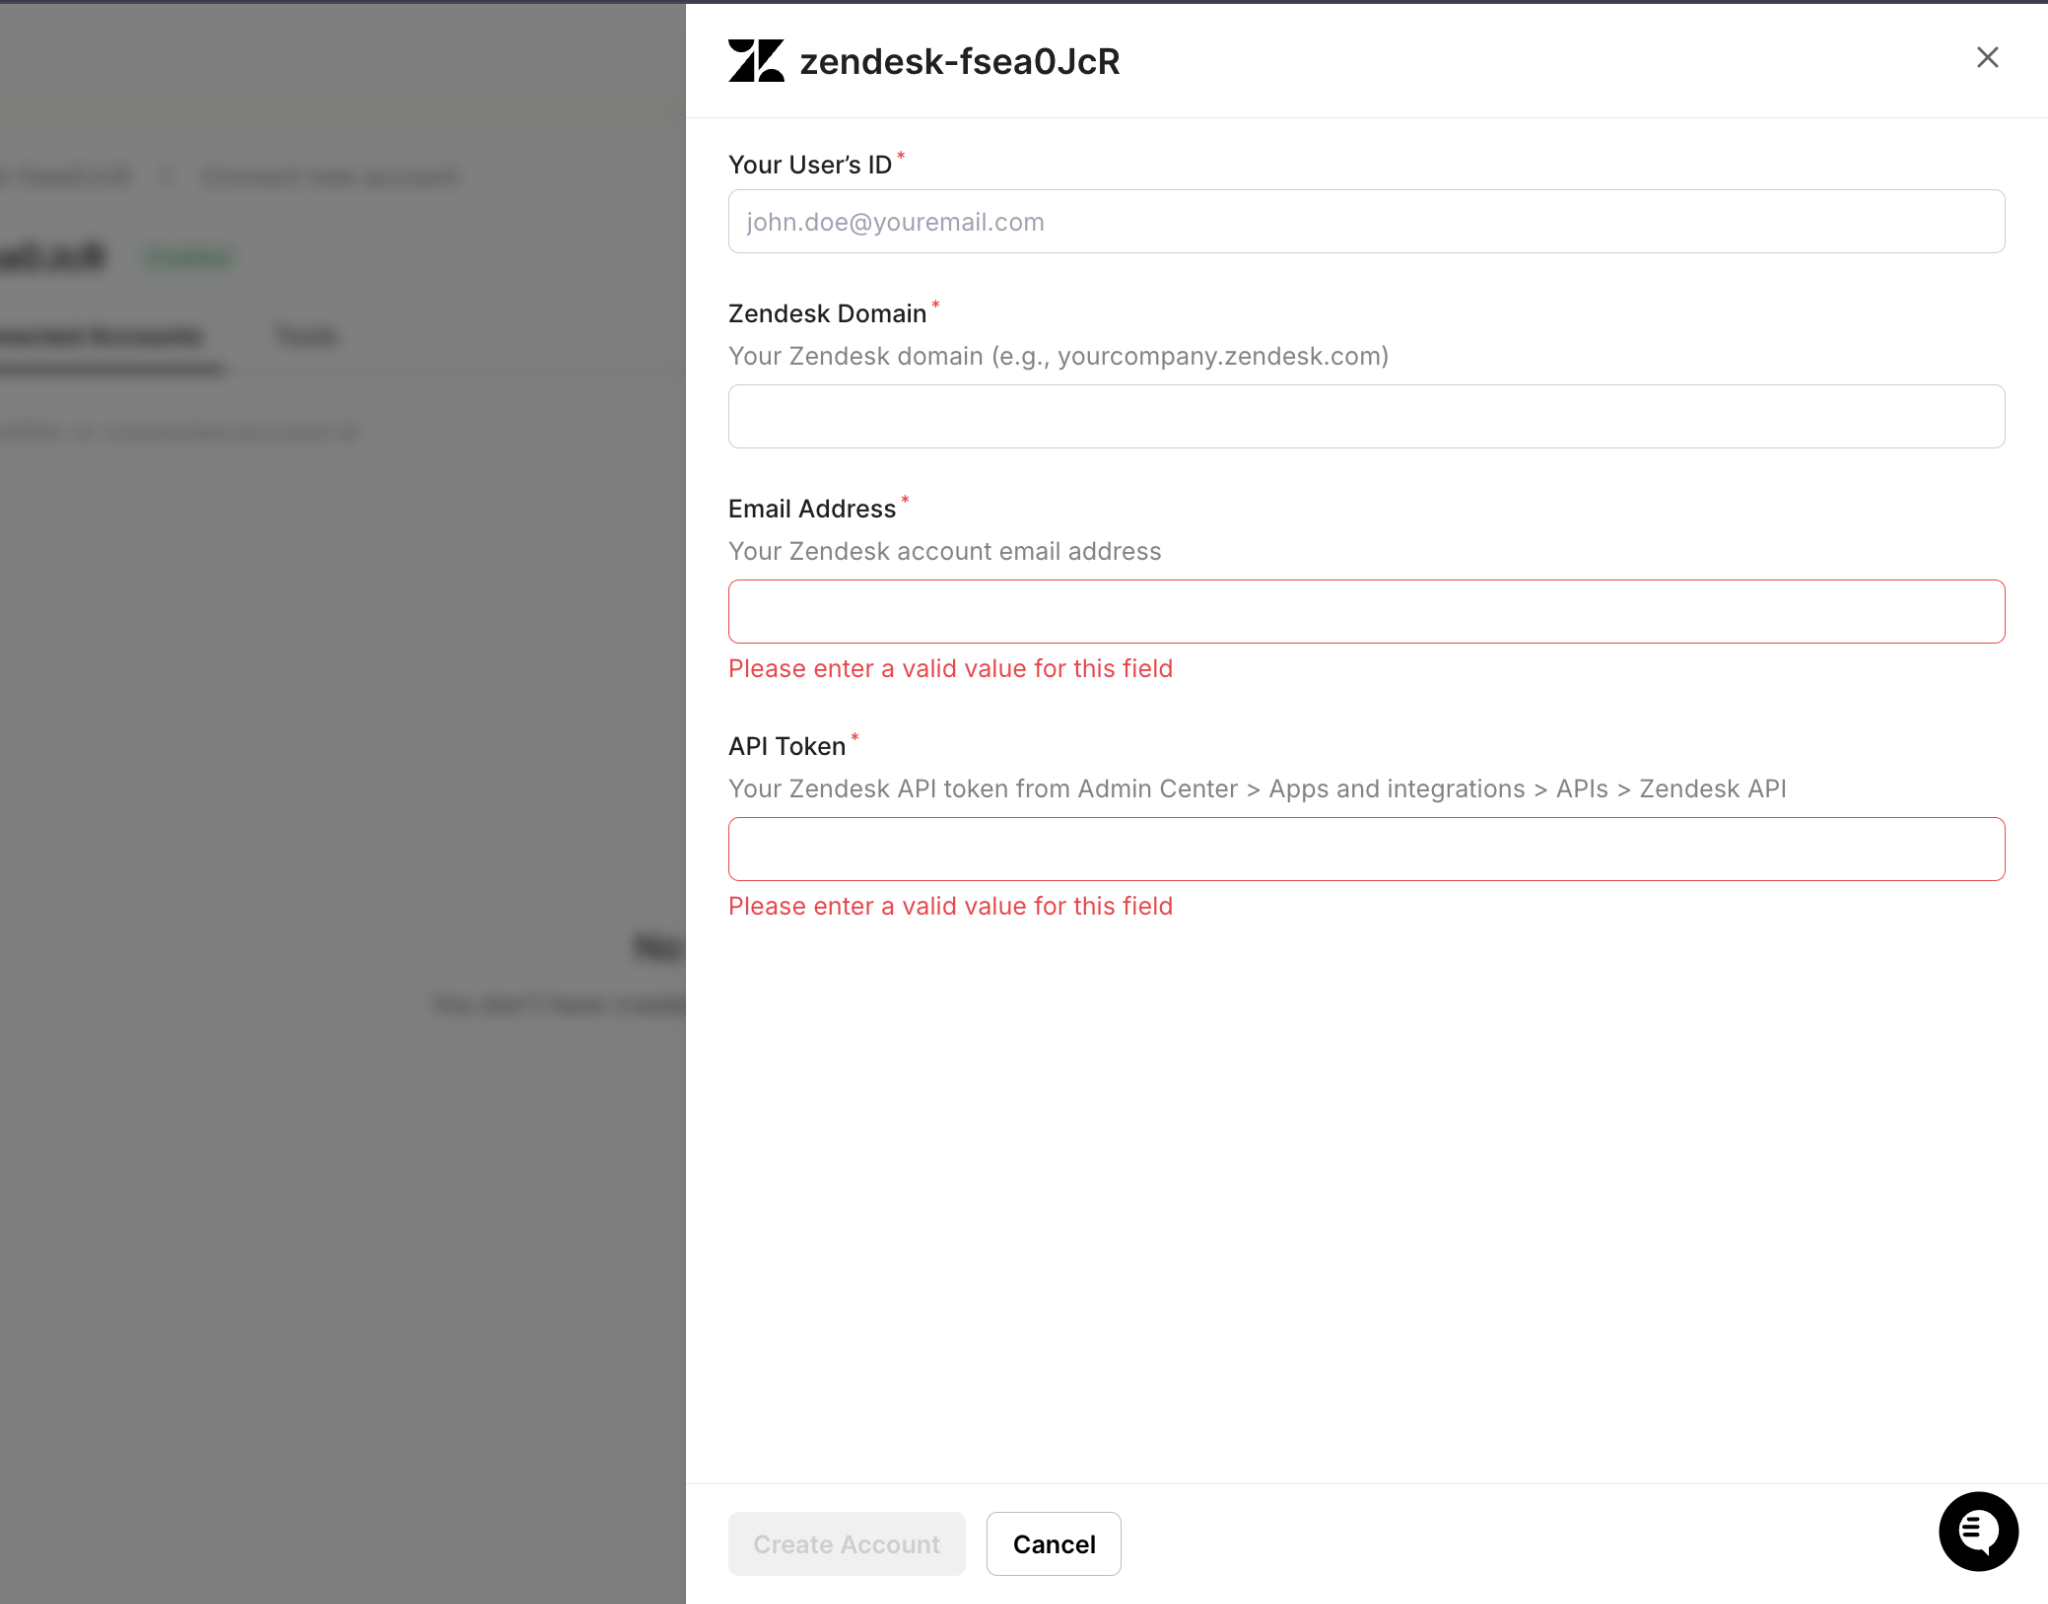
In the Scalekit dashboard, navigate to Agent Auth > Connections and search for Zendesk. Enter your Zendesk email and API token. Make sure the subdomain field matches your account: if your URL is yourcompany.zendesk.com, the subdomain is yourcompany.
Step 3: Add the Notion Connector
Add Notion with scopes for reading pages and querying databases. After completing OAuth, share your KB database with the integration: open the database in Notion, click the three-dot menu, select Connections, and add your Scalekit integration. Without this step, notion_page_search returns empty results with no error. The NOTION_DB_ID is the alphanumeric string in your Notion database URL after the workspace name.

Step 4: Add the Slack Connector
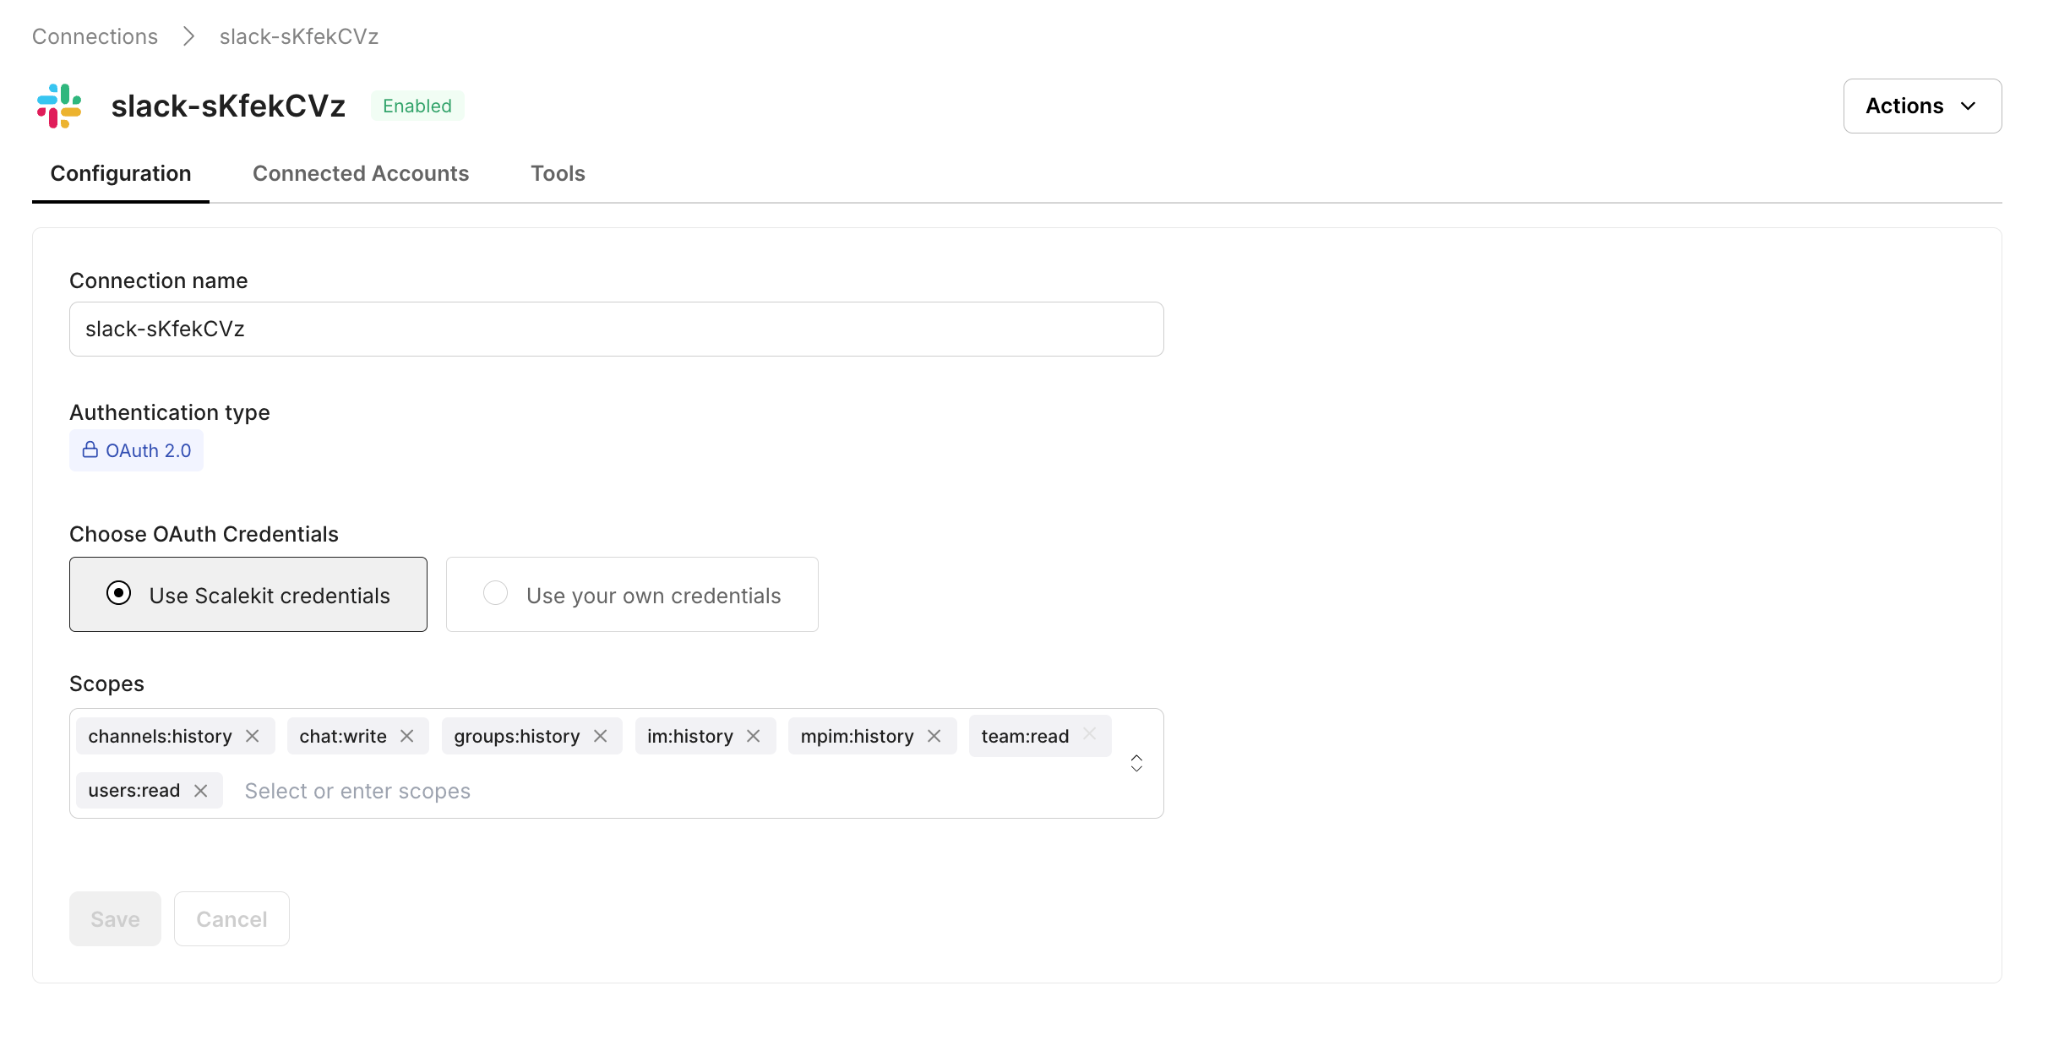
Add Slack with the chat:write scope. After OAuth, invite the bot to each routing channel by typing /invite @your-bot-name in the channel. Do this for #engineering, #billing, #product-feedback, and #support-triage before running the agent.
Setting Up Auth with Claude Code
Once your connectors are configured in the Scalekit dashboard, the Scalekit Claude Code plugin automatically generates the auth scaffold. Install it with two commands:
Then prompt Claude Code:
Claude Code generates three things: the Scalekit client initialization, the connector user map, and two helper functions.
The Scalekit Client and Connector Map
The client initialization connects to your Scalekit workspace. The CONNECTOR_USERS map specifies the identity to act on behalf of when calling each service. Every execute_tool() call downstream uses this map to route the request to the right connected account.
The tool() Helper
The tool() function is the single interface for every API call in the pipeline. It wraps execute_tool() with the connector name, user identity, and input parameters so that every service interaction follows the same three-argument pattern.
A Zendesk fetch looks like tool('zendesk', 'zendesk_search_tickets', query='...'). A Notion search looks like tool('notion', 'notion_page_search', query='...'). A Slack post looks like tool('slack', 'slack_send_message', channel='#engineering', text='...'). The pattern never changes, regardless of which service is being called.
The ensure_authorized() Startup Check
The ensure_authorized() function runs once at startup for each connector and confirms it is in ACTIVE status. If a connector needs authorization, it generates a magic link on the spot so you can complete OAuth without going back to the dashboard.
On the first run, this function pauses for any connector that needs authorization. On every subsequent run, all three connectors print ACTIVE and the pipeline proceeds immediately.
The Five-Step Triage Flow
With auth in place, the pipeline runs the same five steps for every new ticket it finds. Each step is independent: a failure in one does not block the others. If Notion is unreachable, the ticket still gets classified, routed to Slack, and updated in Zendesk. The Zendesk update always runs last, regardless of what happened earlier.
Step 1: Fetching New Tickets from Zendesk
The agent queries Zendesk for all tickets with status new or open, sorted by creation date. It filters out already-processed tickets using a local state file at state/processed_tickets.json. This file persists across restarts, so a polling agent that gets restarted mid-day does not re-triage tickets it already handled.
Step 2: Classifying Each Ticket with an LLM
For each new ticket, the agent sends the subject and description to OpenRouter with a structured classification prompt. The model returns a JSON object with four fields:
- category: one of: billing, bug, feature_request, how_to, account_issue
- severity: P0 (service down), P1 (major feature broken), P2 (minor/single-user), P3 (question or low-impact ask)
- summary: one sentence describing the core issue
- suggested_response: a 2 to 3-sentence draft reply ready for the agent to review
The recommended model is openai/gpt-4o-mini via OpenRouter: fast, under a cent per classification, and consistently follows the structured JSON output format. A rule-based fallback using keyword matching handles cases where OpenRouter is unavailable entirely.
Step 3: Searching Notion for KB Articles
For tickets classified as bug, how_to, or account_issue, the agent searches the Notion KB using the ticket subject as the query. Billing and feature_request tickets skip this step.
When NOTION_DB_ID is set, the search targets that specific database, which is faster and more precise than a global workspace search. The top three matches are included in both the Slack alert and the Zendesk internal note. If Notion returns no results, triage continues without KB articles.
Step 4: Routing to the Right Slack Channel
With classification and KB search complete, the agent posts a structured alert to the appropriate channel:
If the post to the target channel fails because the bot is not in the channel, the agent automatically retries on #support-triage as a fallback. No alert is ever silently lost.
Step 5: Updating the Zendesk Ticket
The final step writes the triage result back to Zendesk in two calls: one to update the metadata and one to add an internal note.
The internal note is private, visible only to agents. It contains the category, severity, summary, KB article links, and the suggested response. Any agent who opens a ticket in Zendesk, whether or not they saw the Slack alert, has immediate context.
How to Run the Full Pipeline
With connectors active and the .env file configured, start the agent:
The agent prints a live status update at each stage. Here is what a typical three-ticket run looks like:
For continuous operation, set POLLING_MODE=true in your .env file. The agent polls Zendesk every POLL_INTERVAL_MINUTES (default: 2 minutes). For business-hours-only coverage, a cron job is a clean alternative:
What It Takes to Run This Pipeline Reliably in Production
While the core pipeline is straightforward, a few additional safeguards are required to make it reliable in a real-world environment where failures, retries, and rate limits are unavoidable.
Preventing Duplicate Processing
The agent maintains a local state file to track processed tickets. To avoid corruption and duplicate processing:
- State updates are written to a temporary file and atomically renamed, ensuring that crashes during writes never corrupt the state file
- Ticket IDs are marked as processed before the pipeline runs, preventing duplicate Slack alerts if the process crashes mid-execution
- The state file is capped to a fixed size, evicting older entries to prevent unbounded growth over time
This approach prioritizes avoiding duplicate alerts, which are more disruptive to support workflows than the occasional missed ticket.
Handling LLM Failures and Unexpected Output
LLM responses are validated before being used in the pipeline:
- Categories and severity levels are checked against predefined allowed values
- Invalid outputs fall back to safe defaults (e.g., account_issue, P2)
- If the LLM is unavailable or fails, a rule-based classifier takes over using keyword matching
This ensures that classification remains stable even when the model behaves unexpectedly or is temporarily unavailable.
Improving Knowledge Base Retrieval
Instead of relying on the raw ticket subject, the system uses the LLM-generated summary as the search query for Notion.
This significantly improves retrieval quality, since summaries capture the actual issue in structured language, whereas ticket subjects are often vague or inconsistent.
Respecting API Rate Limits
To avoid hitting service limits during batch processing, the pipeline introduces a small delay between tickets.
This ensures compatibility with:
- Slack rate limits (~1 message/sec per channel)
- Notion API limits
- Zendesk plan-based rate limits
Normalizing Ticket Identifiers
Zendesk may return ticket IDs as floats (e.g., 4.0), while the de-duplication logic expects string IDs (e.g., "4"). Without normalization, this can cause tickets to be reprocessed repeatedly.
To prevent this, all ticket IDs are normalized before comparison, ensuring consistent behavior across polling cycles.
Common Pitfalls to Check Before Going Live
Before running the pipeline in a production environment, it is important to verify a few configuration details across each service. Most runtime issues are not caused by logic errors, but by small setup mismatches.
Zendesk: Subdomain and Field Configuration
Make sure the connector subdomain exactly matches your Zendesk account URL. Even a small mismatch can result in authentication failures that appear identical to invalid credentials.
If your workflow involves updating custom ticket fields, verify the numeric field IDs from the Zendesk admin panel. Field names alone are not sufficient when making API calls.
Notion: Database Access and Query Scope
Ensure that the integration has been explicitly shared with your knowledge base database, not just authorized at the workspace level. If this step is missed, queries may return empty results without any error.
For larger workspaces (500+ pages), it is recommended to set NOTION_DB_ID and query a specific database instead of relying on global search, which can be slower and less precise.
Slack: Channel Access and Rate Limits
The Slack bot must be invited to every channel defined in your routing configuration before the pipeline runs. Otherwise, message delivery will fail.
Slack enforces a rate limit of approximately one message per second per channel. If you are processing a large batch of tickets on startup, consider introducing a small delay between messages to avoid throttling.
LLM Classification: Model Behavior and Output Consistency
The classification prompt is optimized for openai/gpt-4o-mini via OpenRouter. If you switch to a different model, test it with real ticket data to ensure consistent output.
Smaller or less capable models may return malformed JSON or unexpected category values, triggering fallback logic or incorrect routing.
Conclusion
The triage problem is not a technology problem; every tool needed to solve it is already in use by most support teams. The problem is pulling them together consistently, for every ticket, all day, without manual effort.
This agent closes that gap; it runs the same cycle for every ticket: classify, search, route, update. The support team opens Slack and sees alerts already sorted by severity, with KB articles attached and draft responses ready. The engineering team sees bugs, the billing team sees billing issues.
The same architecture extends naturally to more complex workflows. Security incidents can pull from vulnerability databases. Enterprise tickets can include account tier data fetched from Salesforce before routing. Escalation rules can auto-assign when severity exceeds a threshold. Once the Scalekit connectors are in place and the execute_tool() pattern is established, adding a new data source or routing rule is a matter of updating the triage logic, not rebuilding the auth layer underneath it.
If you're looking for similar implementations, check out how to automate Slack workflows with LangGraph and Scalekit, or explore building production-ready agent workflows with remote MCP servers.
FAQ
Why use Scalekit instead of calling each API directly?
Each service has its own auth flow, token format, and refresh schedule. Scalekit collapses all of it into a single execute_tool() call per service and automatically handles token refresh. Auth goes from a multi-day implementation to a 20-minute configuration.
Does Scalekit handle token refresh automatically?
Yes. It checks token expiry on every execute_tool() call and refreshes using the stored refresh token when needed. There is no refresh logic in the agent code, and no mid-run failures due to a token expiring during a long polling session.
Can I customize the classification categories?
Yes. The categories and severity definitions are defined in the LLM prompt within classify_ticket(). Add or rename categories there, then update CHANNEL_MAP with the corresponding Slack routing entries. The rule-based fallback also uses keyword lists per category that need to be updated to match.
What if Notion or Slack is unavailable during a run?
Each step is independent. If Notion fails, the Slack alert is sent without KB articles. If Slack fails, the agent retries on #support-triage. The Zendesk update always runs last, regardless, so every ticket gets classified and tagged even if earlier steps encountered errors.
How do I add a new routing channel?
Add an entry to CHANNEL_MAP and add the new category to the LLM prompt. For example, to route security tickets to #security, add 'security': '#security' to the map and include security as a valid category in the classification prompt.
Can I run this for multiple support teams?
Yes. Each team gets its own .env file with different Zendesk credentials, a different Notion database, and different Slack channels. Run a separate instance per team. Scalekit manages each set of connected accounts independently.